Progress Infographics
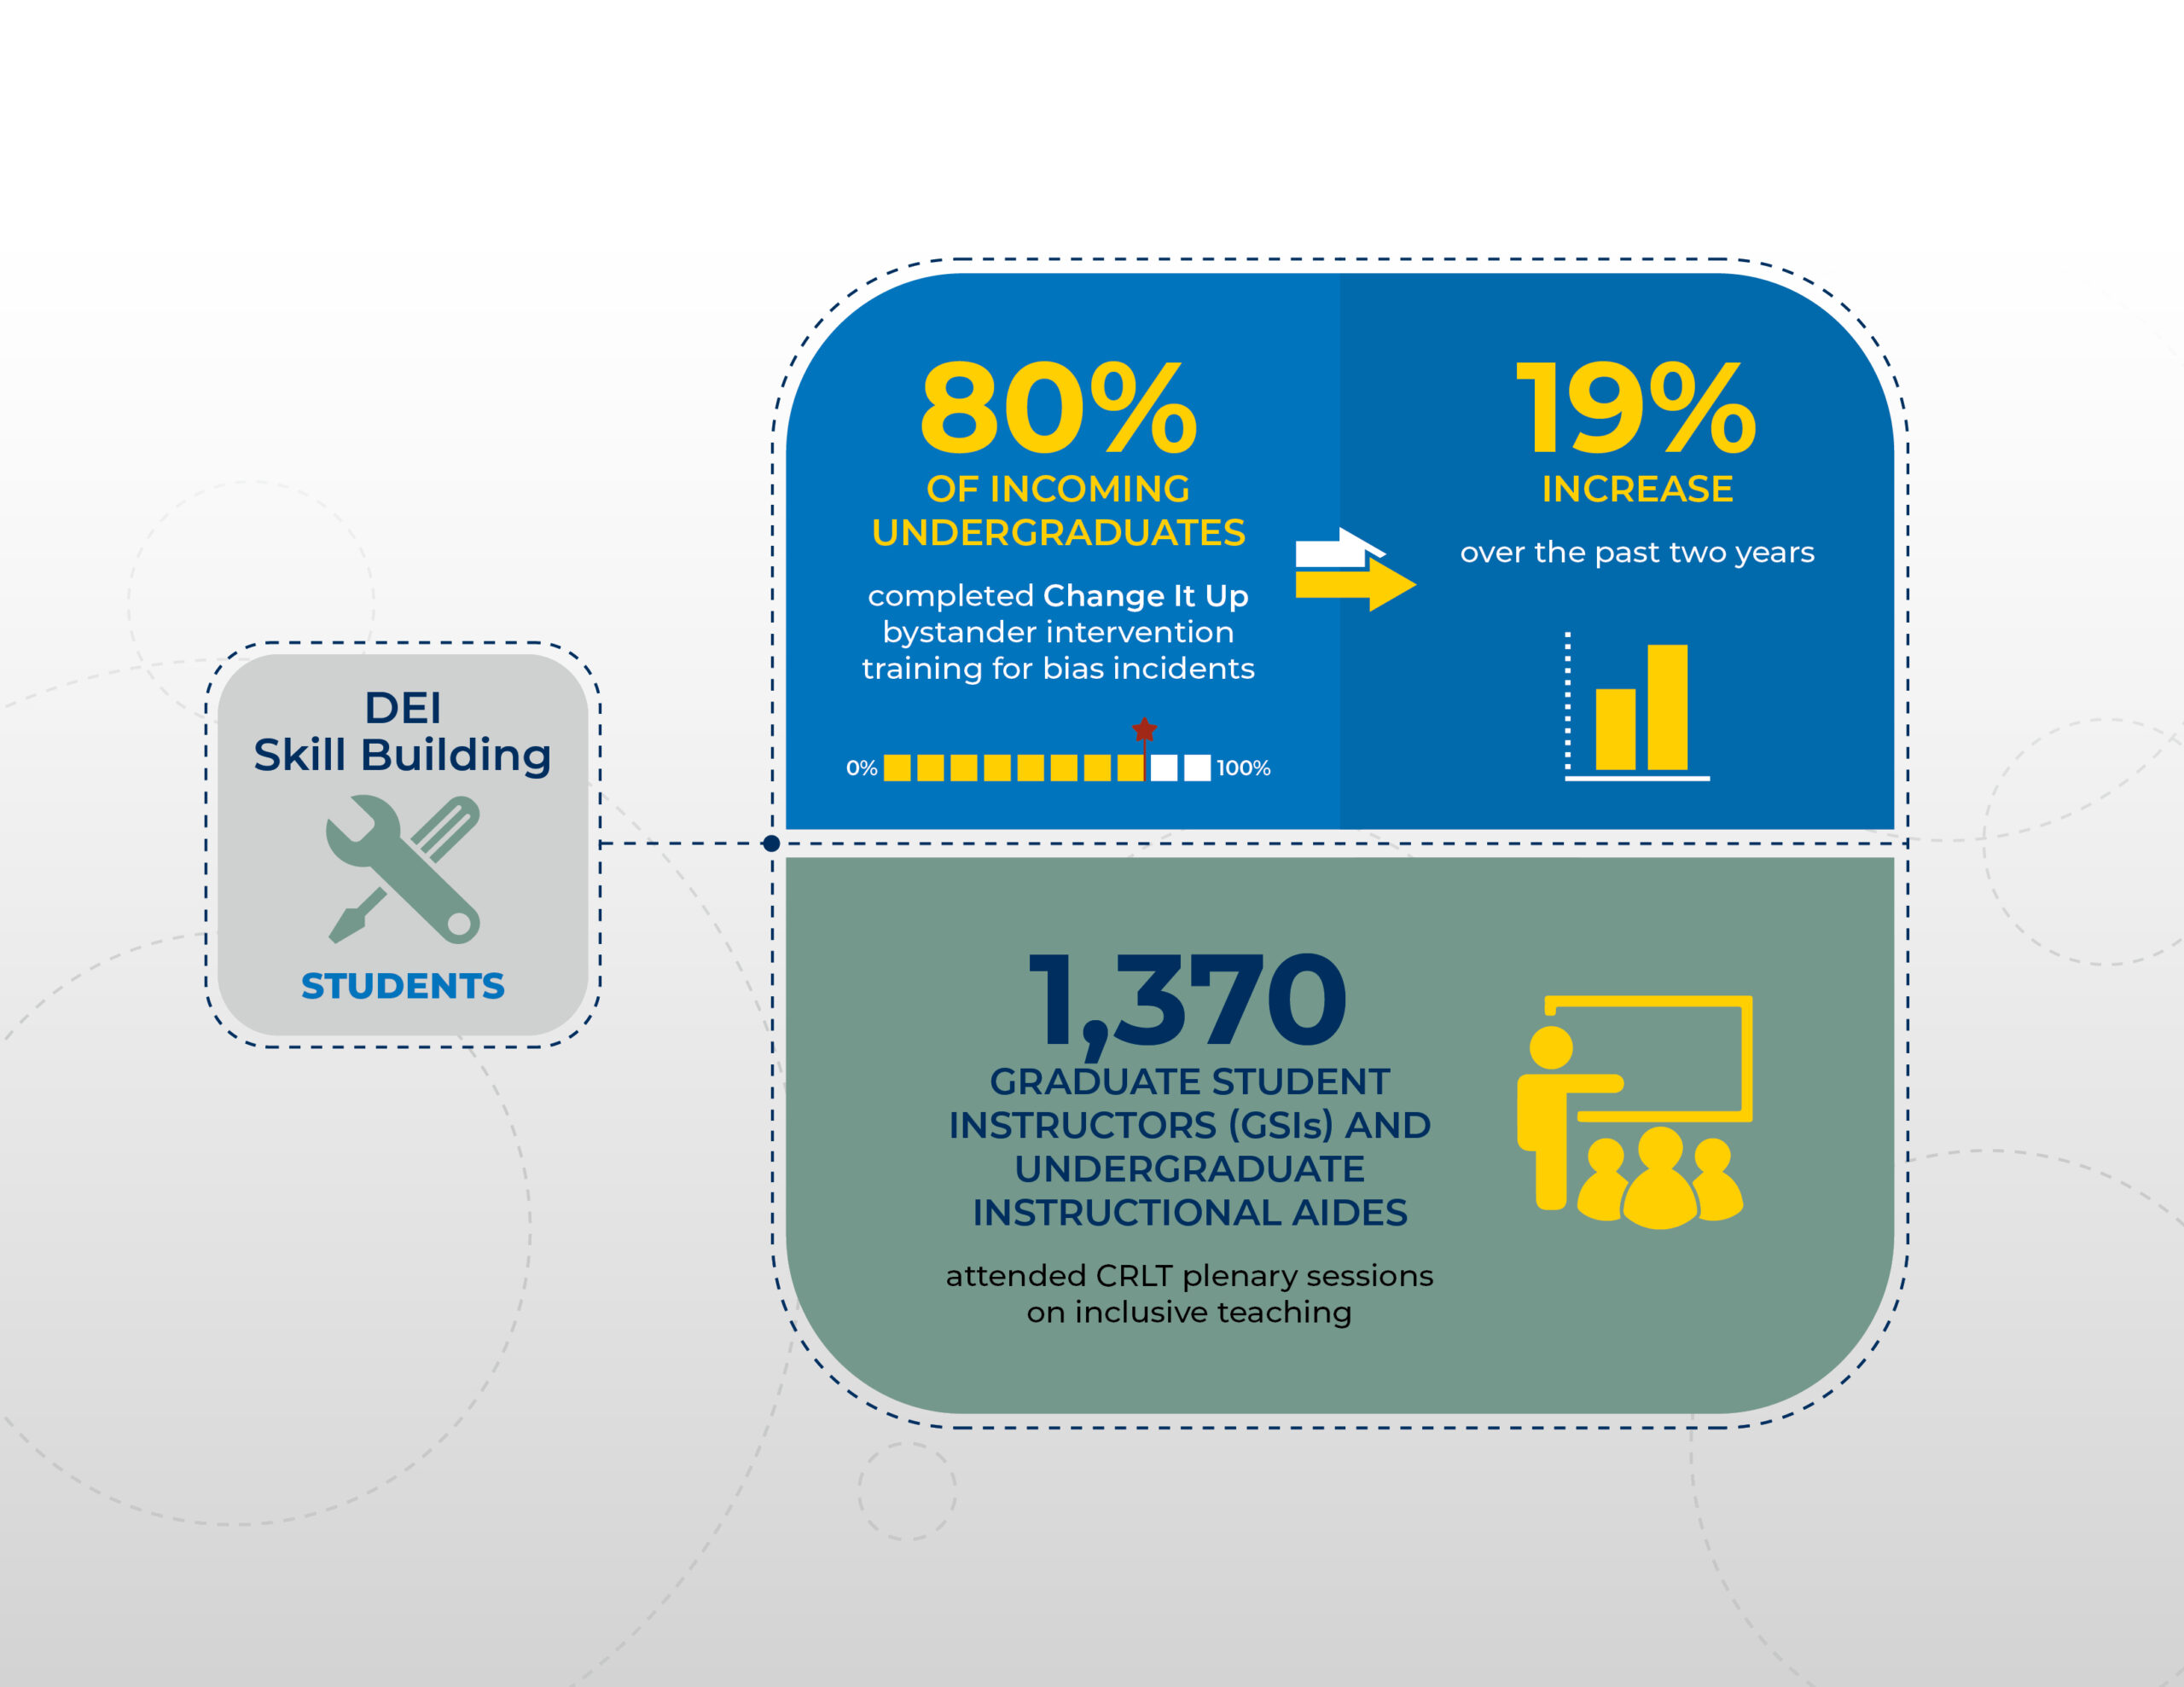
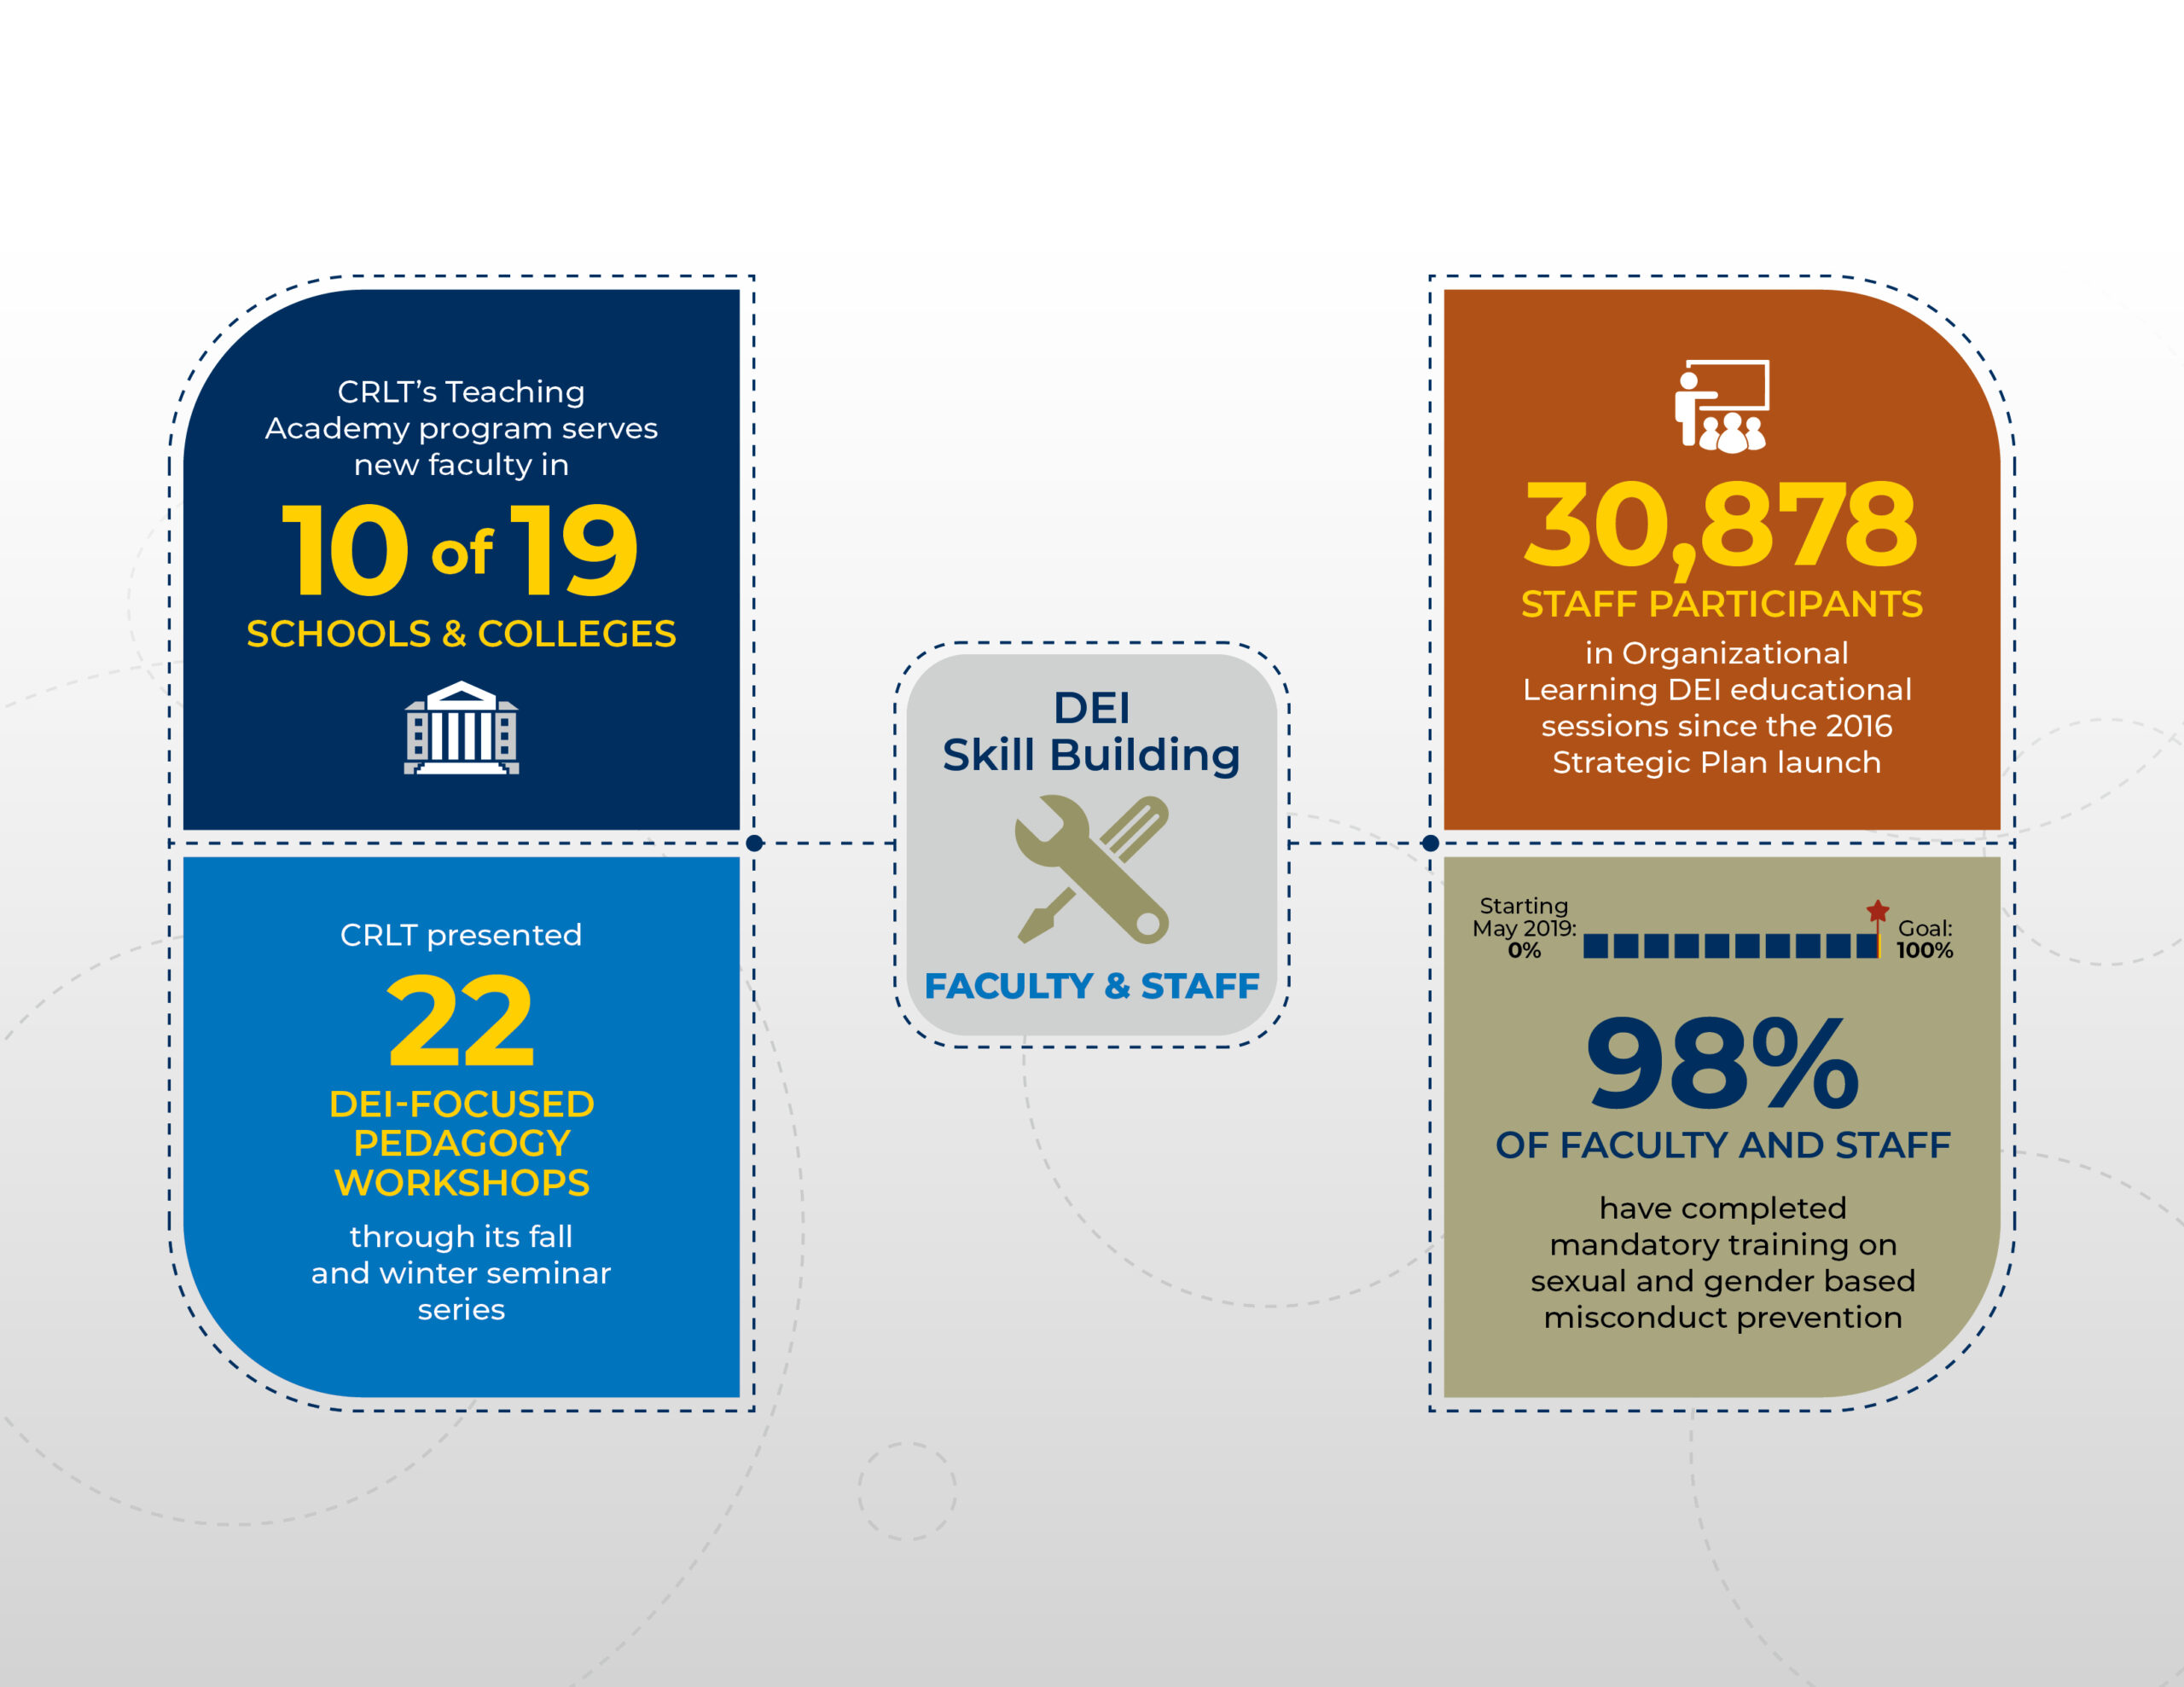
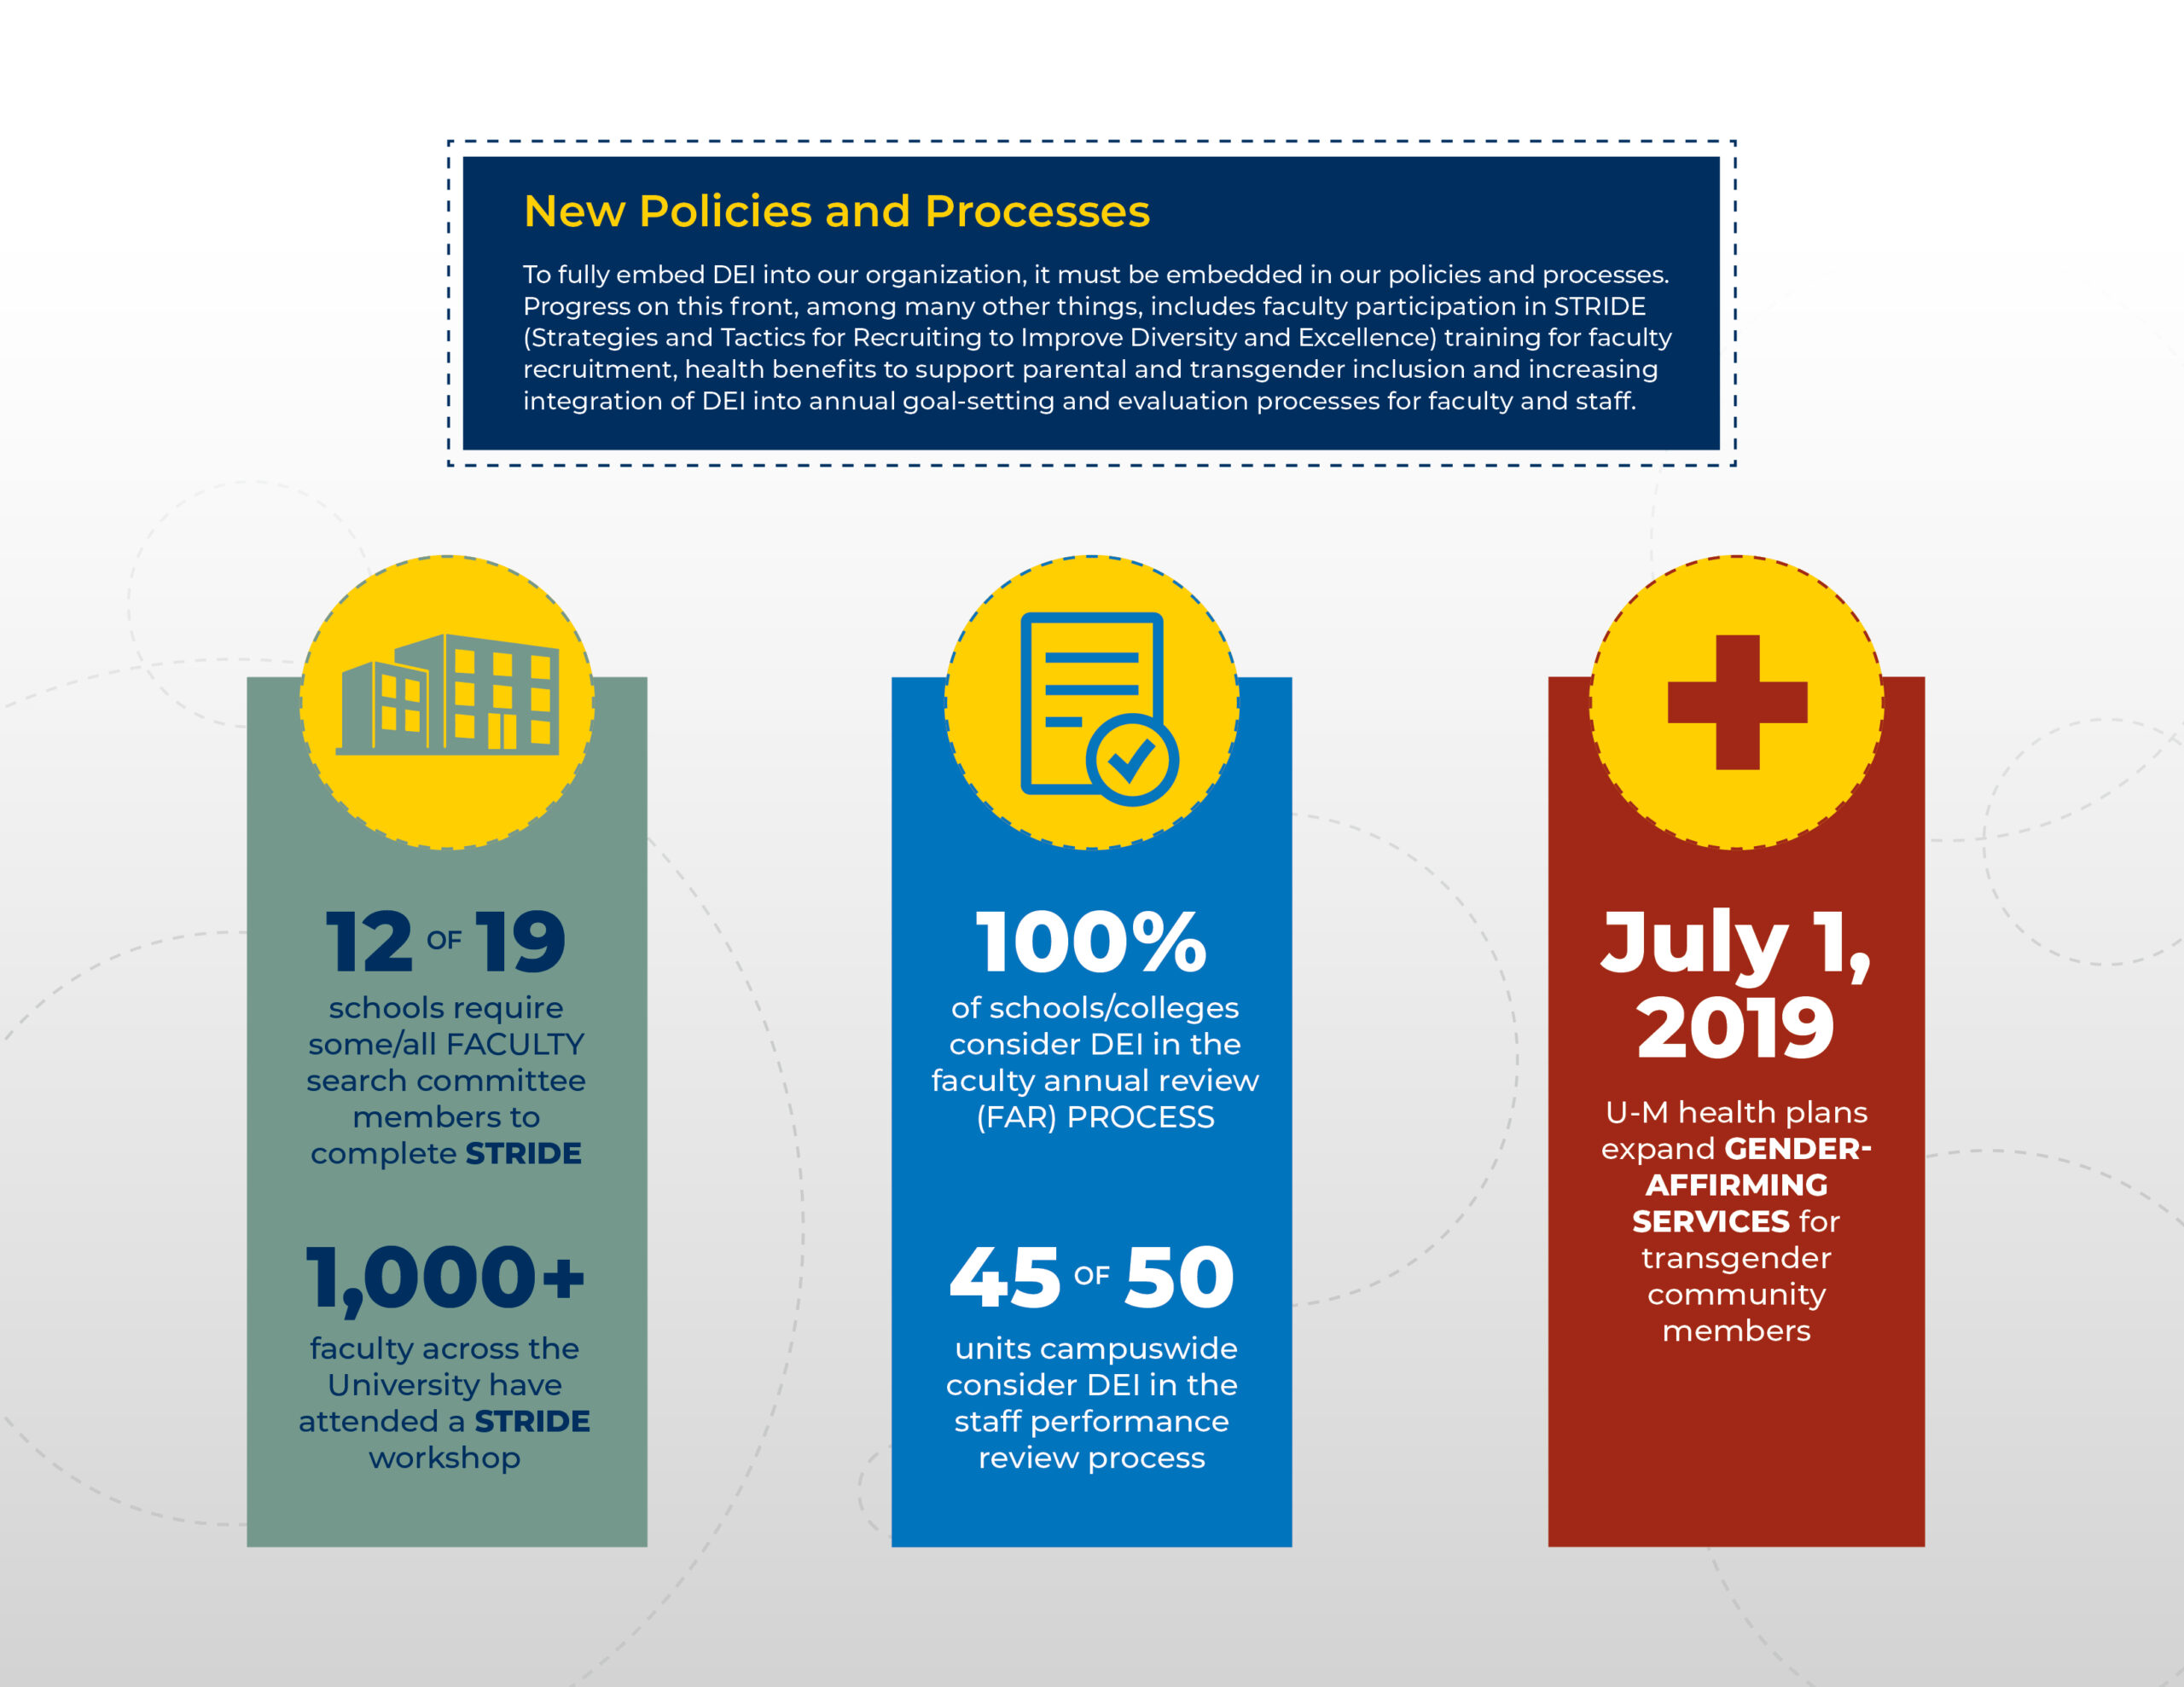
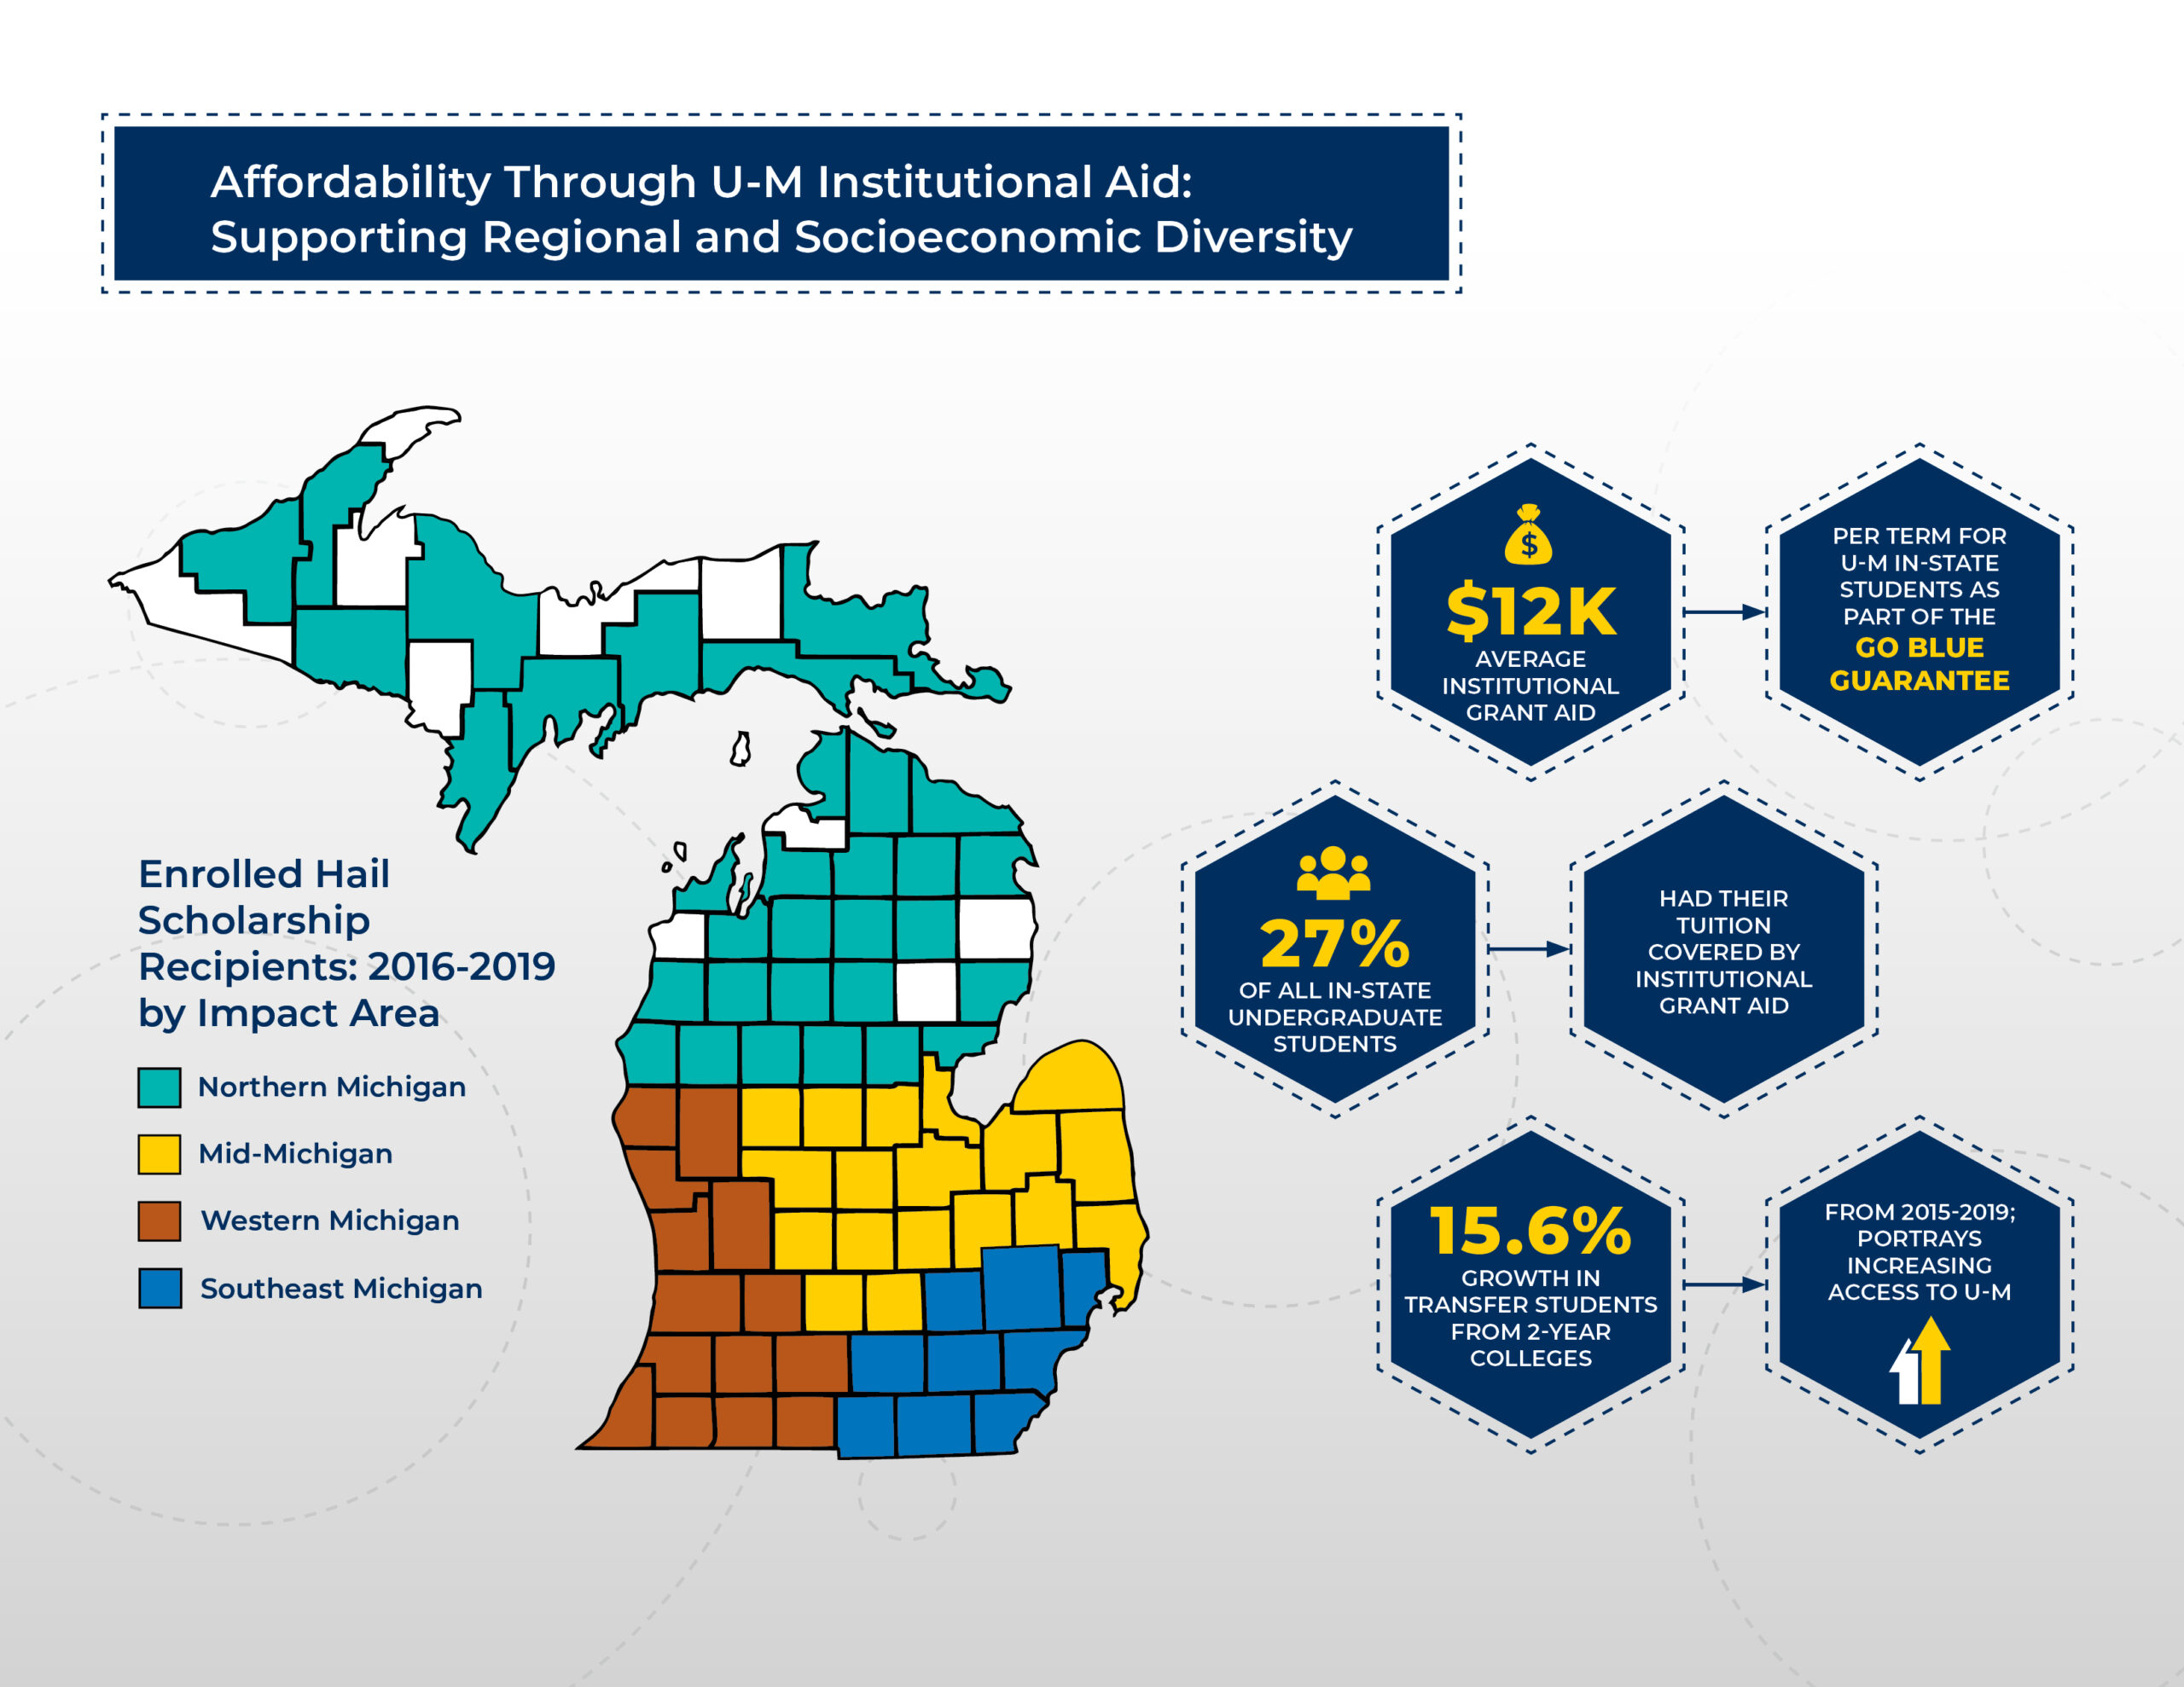
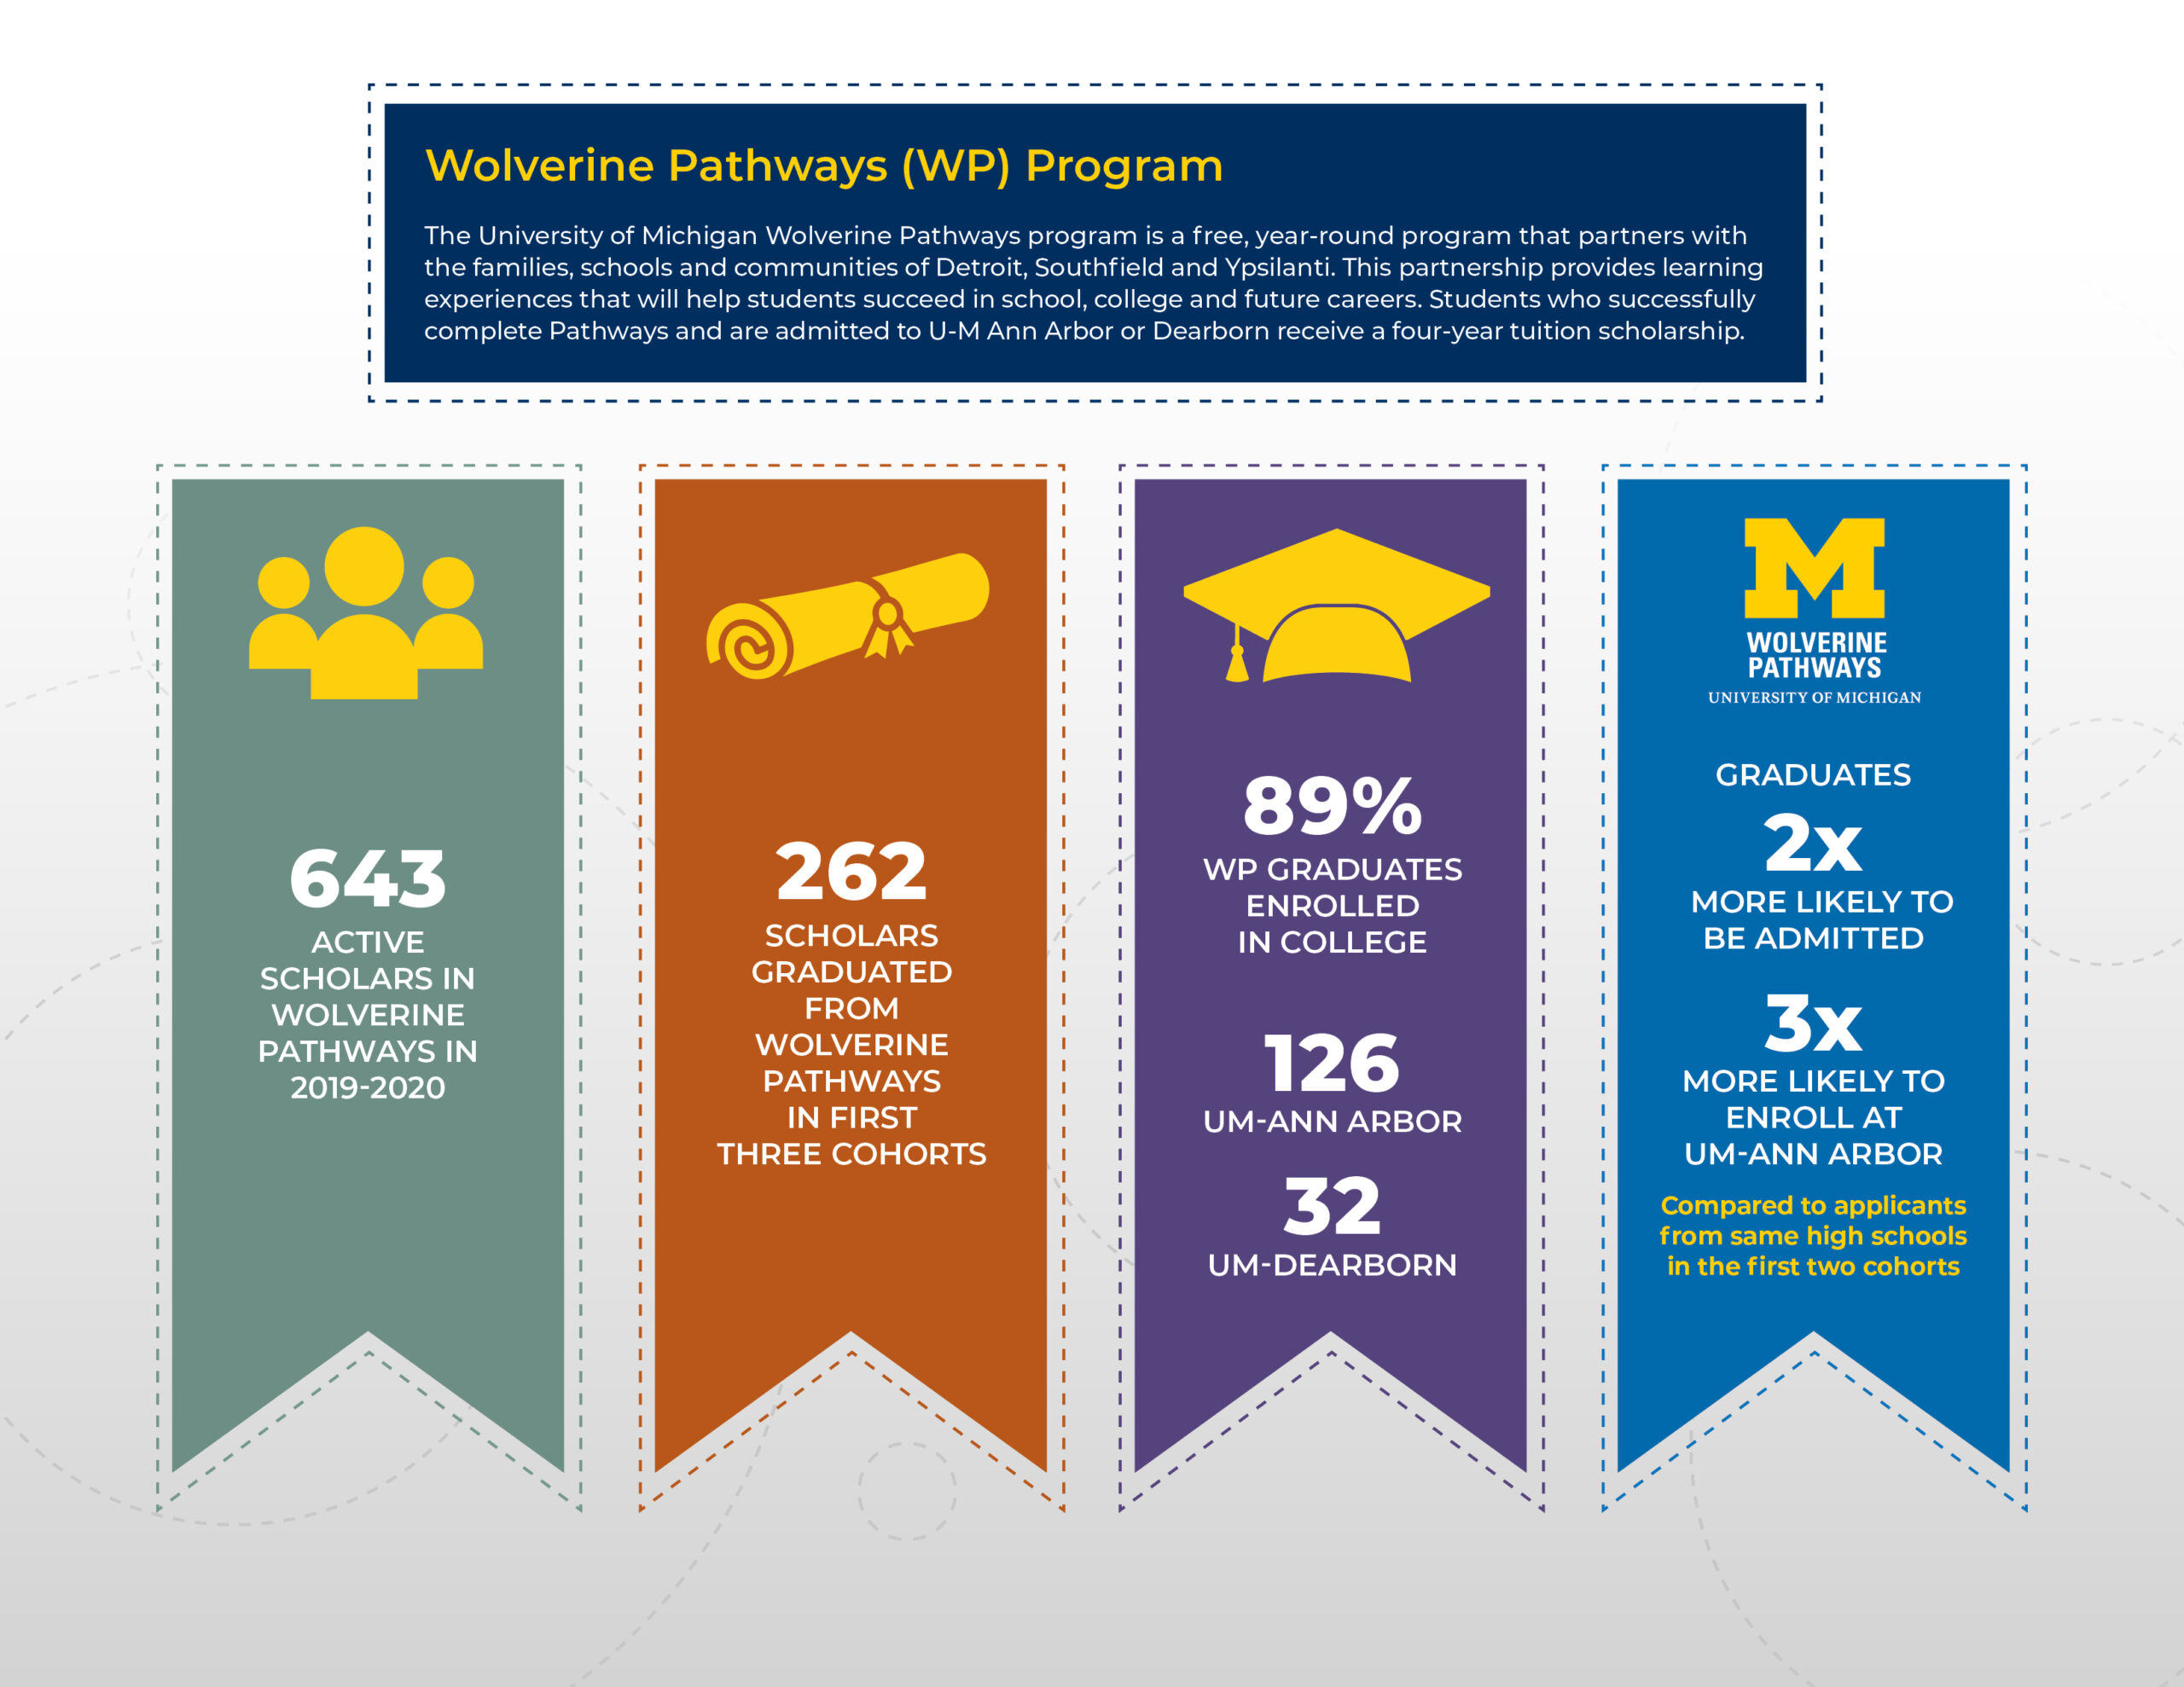
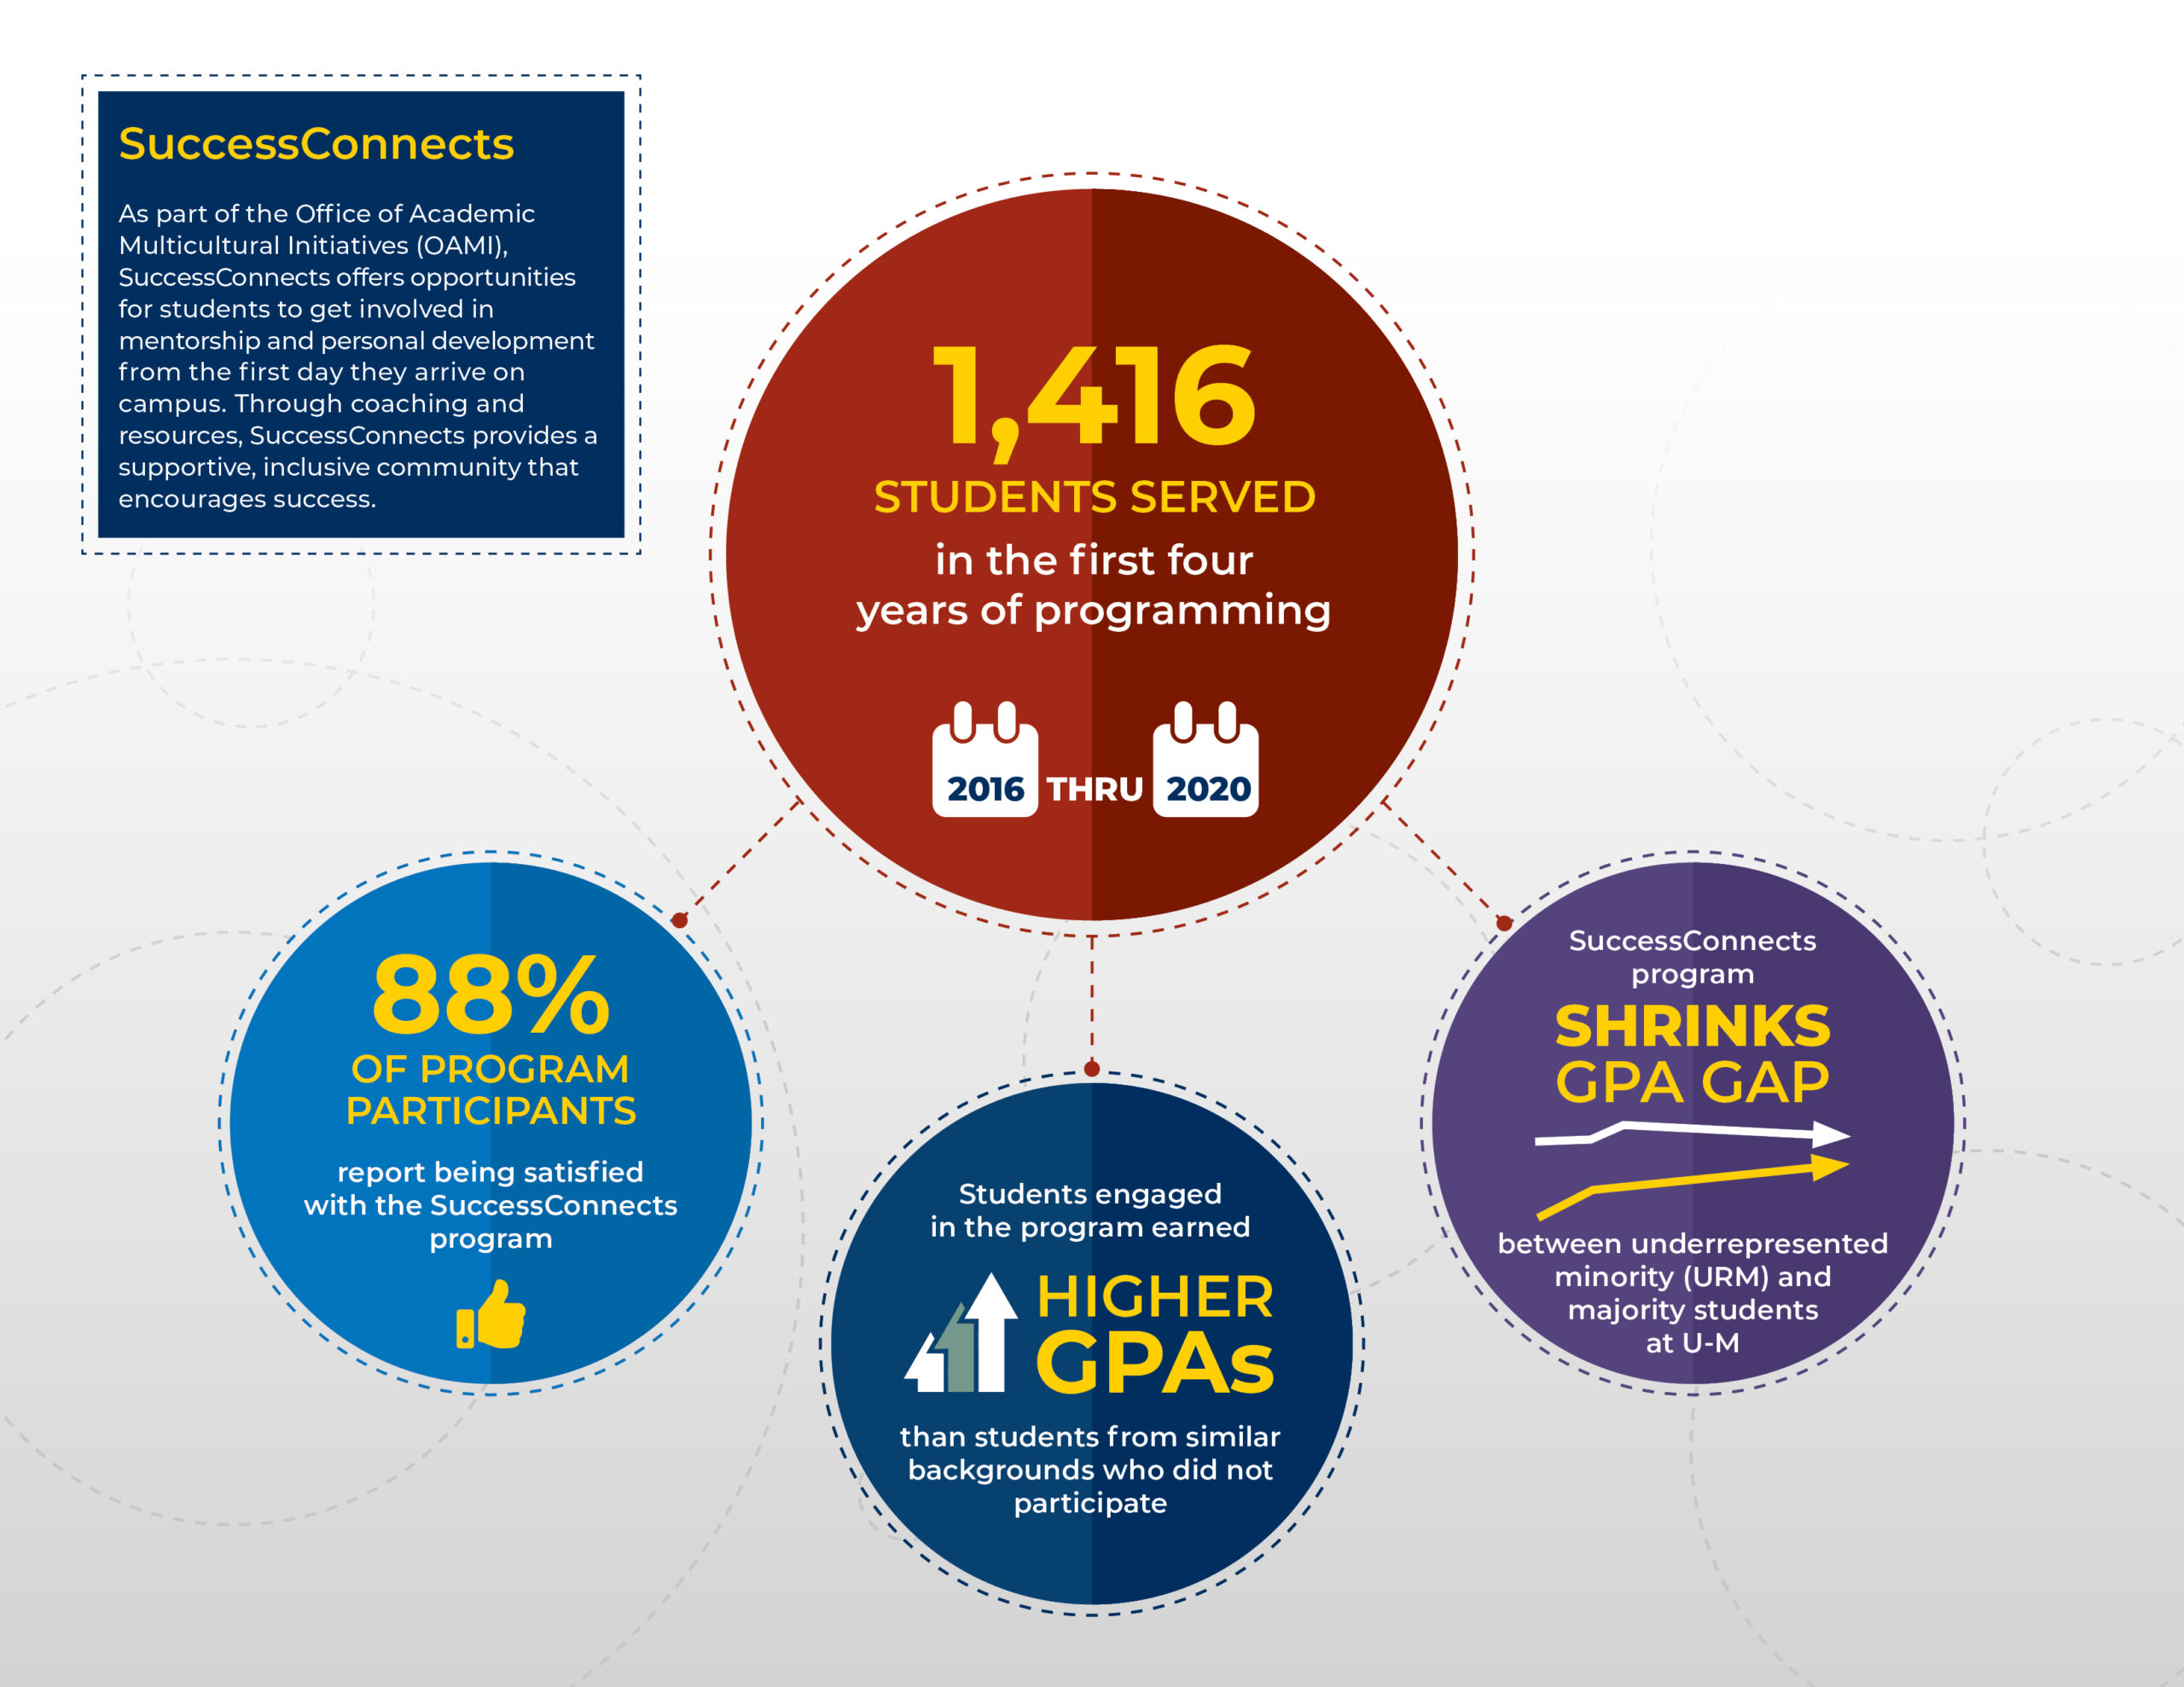
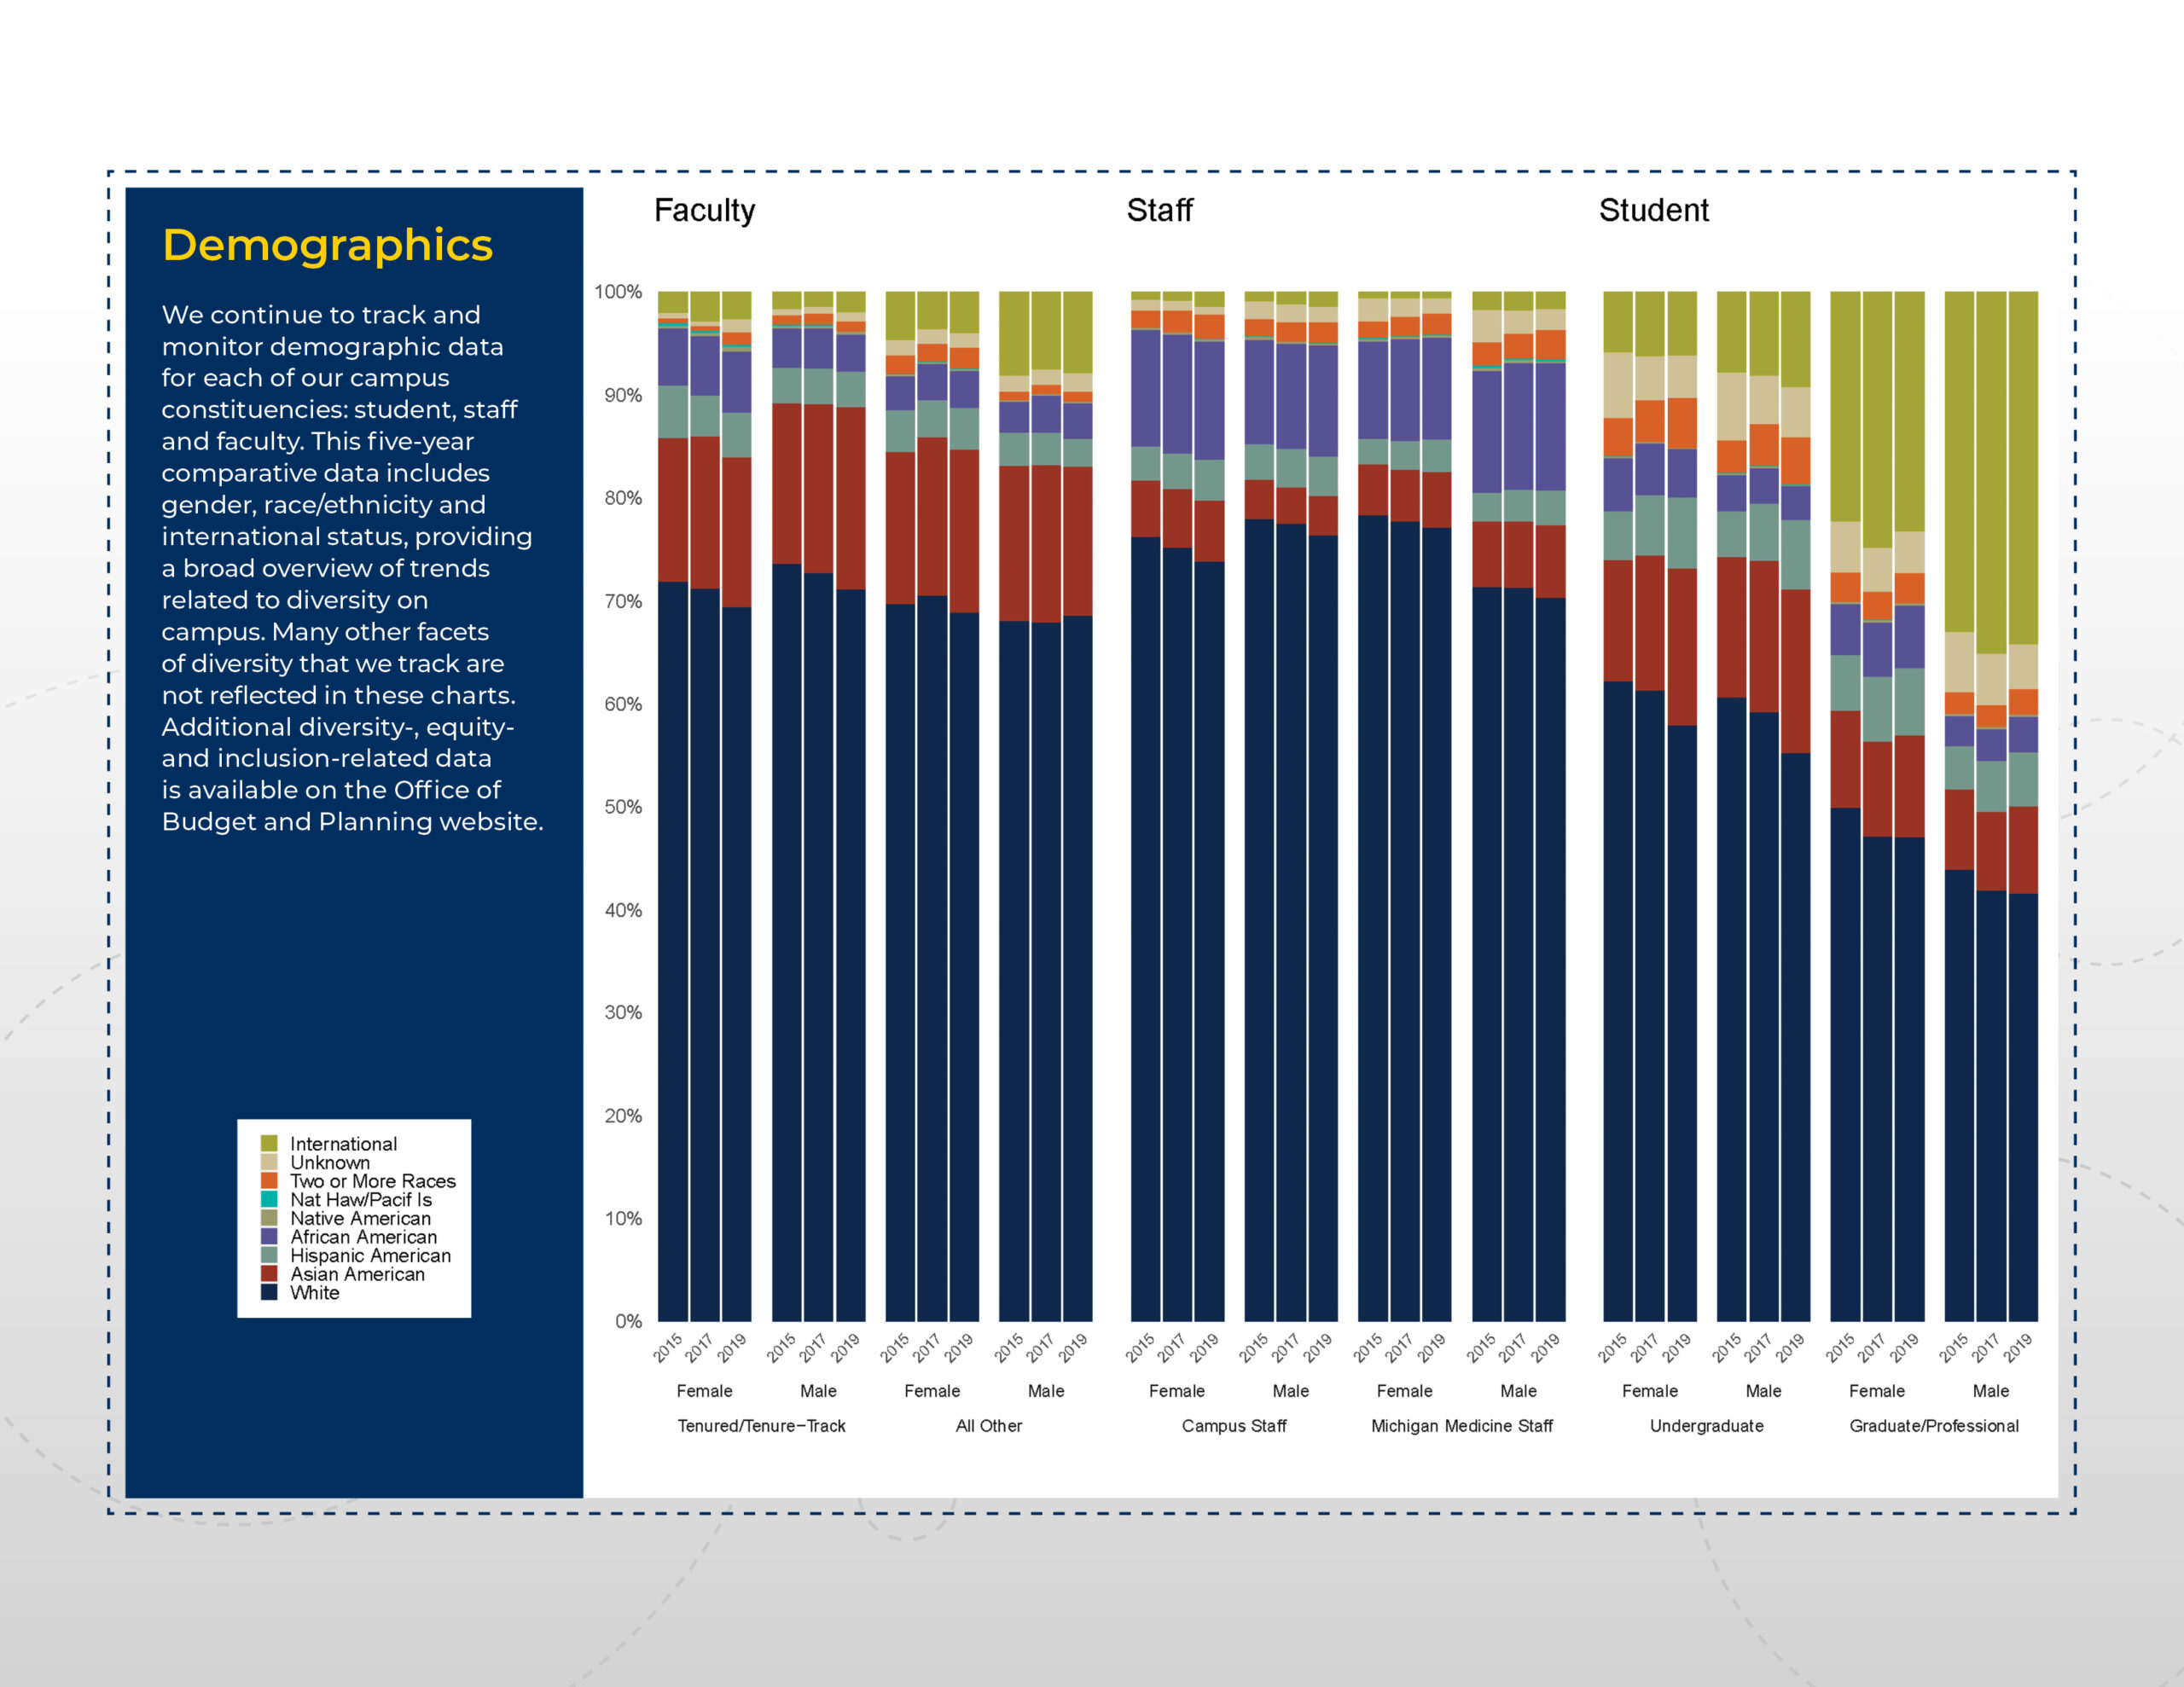
In collaboration with many campus partners, we assembled data on key initiatives supporting achievement of our DEI goals and created data visualizations to help tell the story of DEI progress. The infographics below provide updates and insight on significant progress indicators and demonstrate the impact of services, programs and policies that advance diversity, equity and inclusion.
